User guide
[ ]:
from datetime import datetime

import agrometeo as agm
The core object of agrometeo-geopy is the AgrometeoDataset, which can be instantiated providing a Nominatim query (of a Swiss region) as the region argument as in:
[ ]:
agm_ds = agm.AgrometeoDataset(region="Canton de Genève")
Alternatively, the region argument may also be provided as:
A list-like with the west, south, east and north bounds
A geopandas geo-series or geo-data frame
A geometric object, e.g., shapely geometry
A filename or URL, a file-like object opened in binary (‘rb’) mode, or a Path object that will be passed to
geopandas.read_file.
Once instantiated, the stations_gdf property features the stations within the region, with its locations and other attributes:
[ ]:
agm_ds.stations_gdf.head()
| id | name | lat_ch | long_ch | altitude | interval | phone | into_service_at | preview_until | ... | bbox_west | place_id | osm_type | osm_id | lat | lon | display_name | class | type | importance | ||
|---|---|---|---|---|---|---|---|---|---|---|---|---|---|---|---|---|---|---|---|---|---|
| 29 | 44 | DARDAGNY | 487462.0 | 116662.0 | 488 | 10 | 079 332 38 36 | domaine.les.hutins@bluewin.ch | 2005-11-01 | 2023-04-13T16:00:00.000000Z | ... | 5.955911 | 308046120 | relation | 1702419 | 46.225651 | 6.143921 | Geneva, Switzerland | boundary | administrative | 0.550757 |
| 30 | 45 | LA-PLAINE | 489447.0 | 115605.0 | 360 | 10 | 079 332 32 73 | gegedudu@bluewin.ch | 2005-11-02 | 2023-04-13T16:00:00.000000Z | ... | 5.955911 | 308046120 | relation | 1702419 | 46.225651 | 6.143921 | Geneva, Switzerland | boundary | administrative | 0.550757 |
| 31 | 46 | SATIGNY | 491847.0 | 119767.0 | 442 | 10 | 079 332 36 56 | info@champvigny.ch | 2005-11-01 | 2023-04-13T16:00:00.000000Z | ... | 5.955911 | 308046120 | relation | 1702419 | 46.225651 | 6.143921 | Geneva, Switzerland | boundary | administrative | 0.550757 |
| 32 | 47 | PEISSY | 489978.0 | 118092.0 | 450 | 10 | 079 332 32 81 | lesvallieres@bluewin.ch | 2005-11-03 | 2023-04-13T16:00:00.000000Z | ... | 5.955911 | 308046120 | relation | 1702419 | 46.225651 | 6.143921 | Geneva, Switzerland | boundary | administrative | 0.550757 |
| 33 | 48 | ANIERES | 506285.0 | 125138.0 | 412 | 10 | 079 332 38 89 | vinsvillard@bluewin.ch | 2005-11-03 | 2023-04-13T16:00:00.000000Z | ... | 5.955911 | 308046120 | relation | 1702419 | 46.225651 | 6.143921 | Geneva, Switzerland | boundary | administrative | 0.550757 |
5 rows × 33 columns
Similarly, the variables_df property features the available variables and its metadata:
[ ]:
agm_ds.variables_df.head()
| id | color | default_agg | series_style | decimals | order | aggregations | created_at | updated_at | name.de | name.en | name.fr | name.it | unit.de | unit.en | unit.fr | unit.it | actions.update | actions.delete | |
|---|---|---|---|---|---|---|---|---|---|---|---|---|---|---|---|---|---|---|---|
| 0 | 42 | #167687 | sum | Bar | NaN | 0 | [] | 2021-03-09T00:00:56.000000Z | 2021-03-09T00:00:56.000000Z | Blattnässe III | Leaf moisture III | Humectage du feuillage III | Bagnatura fogliare III | ? | ? | ? | ? | False | False |
| 1 | 43 | None | avg | Line | NaN | 0 | [] | 2021-09-11T00:02:00.000000Z | 2021-09-11T00:02:00.000000Z | Spannung interne Lithiumbatterie | Voltage of internal lithium battery | Voltage batterie interne | NaN | Volt | Volt | Volt | NaN | False | False |
| 2 | 1 | #AA0000 | avg | Line | 1.0 | 1 | [{'agg': 'avg', 'label': {'de': 'Temperatur Du... | 2020-12-14T13:17:02.000000Z | 2021-12-07T00:02:25.000000Z | Temperatur +2m | Temperature 2m above ground | Température à +2m | Temperatura a 2m dal suolo | °C | °C | °C | °C | False | False |
| 3 | 4 | #606CB2 | avg | Area | NaN | 2 | [{'agg': 'avg', 'label': {'de': 'Rel. Luftfeuc... | 2020-12-14T13:17:02.000000Z | 2021-10-26T00:02:11.000000Z | relative Luftfeuchtigkeit | Relative humidity | Humidité relative | Umiditá relativa | % | % | % | % | False | False |
| 4 | 6 | #000080 | sum | Bar | 1.0 | 3 | [{'agg': 'sum', 'label': {'de': 'Niederschlag ... | 2020-12-14T13:17:04.000000Z | 2021-12-07T00:02:24.000000Z | Niederschläge | Precipitation | Précipitations | Precipitazioni | mm oder Liter/m2 | mm ou litres/m2 | mm ou litres/m2 | mm ou litres/m2 | False | False |
Given a variable and a time range, the time seres data frame of measurements in the corresponding stations can be obtained with the get_ts_df method as in:
[ ]:
variable = "temperature"
start_date = "2021-08-13"
end_date = "2021-08-16"

ts_df = agm_ds.get_ts_df(variable, start_date, end_date)
ts_df
| name | DARDAGNY | LA-PLAINE | SATIGNY | PEISSY | ANIERES | LULLY | LULLIER | BERNEX | TROINEX | MEINIER |
|---|---|---|---|---|---|---|---|---|---|---|
| time | ||||||||||
| 2021-08-13 00:00:00 | 19.3 | 17.8 | 18.5 | 17.9 | 20.6 | 18.4 | 20.3 | 18.6 | 19.4 | 25.8 |
| 2021-08-13 00:10:00 | 19.6 | 17.9 | 18.4 | 17.7 | 20.0 | 18.3 | 19.6 | 18.7 | 19.1 | 28.6 |
| 2021-08-13 00:20:00 | 19.0 | 17.7 | 18.2 | 17.6 | 19.4 | 18.4 | 19.1 | 18.7 | 19.2 | 24.1 |
| 2021-08-13 00:30:00 | 18.3 | 18.0 | 18.1 | 17.4 | 19.1 | 18.3 | 19.1 | 18.6 | 18.9 | 22.5 |
| 2021-08-13 00:40:00 | 18.7 | 18.0 | 18.1 | 17.6 | 19.1 | 18.0 | 19.0 | 18.7 | 18.5 | 21.5 |
| ... | ... | ... | ... | ... | ... | ... | ... | ... | ... | ... |
| 2021-08-16 23:10:00 | 17.5 | 17.8 | 17.3 | 16.9 | 17.9 | 17.6 | 17.3 | 17.2 | 17.9 | 22.2 |
| 2021-08-16 23:20:00 | 17.4 | 17.9 | 17.4 | 17.1 | 17.9 | 17.6 | 17.3 | 17.2 | 18.0 | 22.0 |
| 2021-08-16 23:30:00 | 17.2 | 17.9 | 17.5 | 17.3 | 17.8 | 17.6 | 17.3 | 17.3 | 18.0 | 21.7 |
| 2021-08-16 23:40:00 | 17.2 | 17.9 | 17.7 | 17.1 | 17.7 | 17.4 | 17.2 | 17.1 | 18.1 | 21.9 |
| 2021-08-16 23:50:00 | 17.1 | 17.8 | 17.5 | 17.1 | 17.7 | 17.3 | 17.1 | 17.1 | 18.1 | 22.0 |
576 rows × 10 columns
The variable argument can be either: - an agrometeo variable code (integer or string) - see the variables_df property above - an essential climate variable (ECV) following the meteostations-geopy nomenclature (string) - an agrometeo variable name (string) - see the variables_df property above
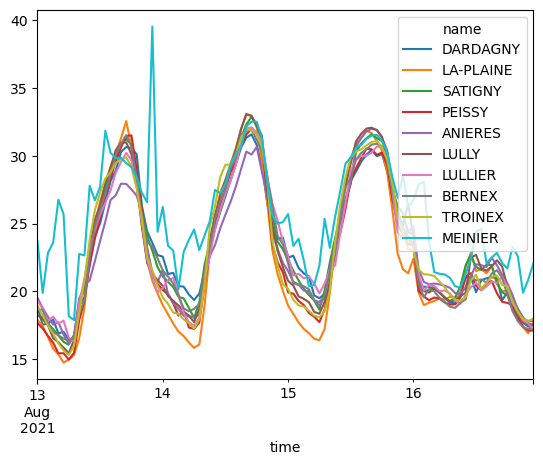
The returned object is a pandas data frame upon which we can operate using any of its supported functions, e.g.:
[ ]:
ts_df.resample("H").mean().plot()
<Axes: xlabel='time'>
We can also use the get_ts_gdf method to include the locations of the stations along with the time series of measurements as in:
[ ]:
ts_gdf = agm_ds.get_ts_gdf(variable, start_date, end_date)
ts_gdf
| time | 2021-08-13 00:00:00 | 2021-08-13 00:10:00 | 2021-08-13 00:20:00 | 2021-08-13 00:30:00 | 2021-08-13 00:40:00 | 2021-08-13 00:50:00 | 2021-08-13 01:00:00 | 2021-08-13 01:10:00 | 2021-08-13 01:20:00 | 2021-08-13 01:30:00 | ... | 2021-08-16 22:30:00 | 2021-08-16 22:40:00 | 2021-08-16 22:50:00 | 2021-08-16 23:00:00 | 2021-08-16 23:10:00 | 2021-08-16 23:20:00 | 2021-08-16 23:30:00 | 2021-08-16 23:40:00 | 2021-08-16 23:50:00 | geometry |
|---|---|---|---|---|---|---|---|---|---|---|---|---|---|---|---|---|---|---|---|---|---|
| name | |||||||||||||||||||||
| DARDAGNY | 19.3 | 19.6 | 19.0 | 18.3 | 18.7 | 18.2 | 17.9 | 17.6 | 17.5 | 17.4 | ... | 17.5 | 17.3 | 17.4 | 17.5 | 17.5 | 17.4 | 17.2 | 17.2 | 17.1 | POINT (5.98084 46.19201) |
| LA-PLAINE | 17.8 | 17.9 | 17.7 | 18.0 | 18.0 | 17.9 | 17.9 | 17.7 | 17.6 | 17.2 | ... | 16.9 | 16.9 | 16.8 | 17.4 | 17.8 | 17.9 | 17.9 | 17.9 | 17.8 | POINT (6.00680 46.18283) |
| SATIGNY | 18.5 | 18.4 | 18.2 | 18.1 | 18.1 | 17.9 | 17.9 | 17.9 | 18.0 | 18.7 | ... | 17.6 | 17.5 | 17.6 | 17.6 | 17.3 | 17.4 | 17.5 | 17.7 | 17.5 | POINT (6.03691 46.22066) |
| PEISSY | 17.9 | 17.7 | 17.6 | 17.4 | 17.6 | 17.7 | 17.6 | 17.5 | 17.2 | 17.0 | ... | 17.1 | 17.2 | 17.3 | 17.1 | 16.9 | 17.1 | 17.3 | 17.1 | 17.1 | POINT (6.01309 46.20529) |
| ANIERES | 20.6 | 20.0 | 19.4 | 19.1 | 19.1 | 19.0 | 18.9 | 18.9 | 18.9 | 18.8 | ... | 17.7 | 17.7 | 17.9 | 17.9 | 17.9 | 17.9 | 17.8 | 17.7 | 17.7 | POINT (6.22292 46.27113) |
| LULLY | 18.4 | 18.3 | 18.4 | 18.3 | 18.0 | 18.2 | 18.2 | 18.0 | 17.8 | 17.7 | ... | 17.5 | 17.5 | 17.6 | 17.6 | 17.6 | 17.6 | 17.6 | 17.4 | 17.3 | POINT (6.07679 46.16735) |
| LULLIER | 20.3 | 19.6 | 19.1 | 19.1 | 19.0 | 18.9 | 19.1 | 19.2 | 18.9 | 18.7 | ... | 17.5 | 17.6 | 17.5 | 17.3 | 17.3 | 17.3 | 17.3 | 17.2 | 17.1 | POINT (6.25441 46.22210) |
| BERNEX | 18.6 | 18.7 | 18.7 | 18.6 | 18.7 | 18.7 | 18.8 | 19.1 | 18.8 | 18.5 | ... | 17.4 | 17.3 | 17.2 | 17.2 | 17.2 | 17.2 | 17.3 | 17.1 | 17.1 | POINT (6.06481 46.16965) |
| TROINEX | 19.4 | 19.1 | 19.2 | 18.9 | 18.5 | 18.4 | 18.4 | 18.6 | 18.4 | 18.1 | ... | 17.9 | 17.6 | 17.6 | 17.8 | 17.9 | 18.0 | 18.0 | 18.1 | 18.1 | POINT (6.15076 46.15991) |
| MEINIER | 25.8 | 28.6 | 24.1 | 22.5 | 21.5 | 19.8 | 19.8 | 20.7 | 20.4 | 19.6 | ... | 21.1 | 21.2 | 22.7 | 22.8 | 22.2 | 22.0 | 21.7 | 21.9 | 22.0 | POINT (6.22334 46.24398) |
10 rows × 577 columns
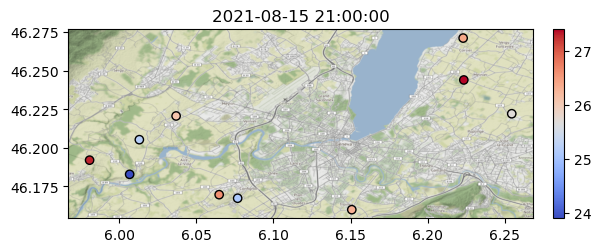
We can then use the plot_temperature_map method to plot a map of the temperature measurements at a given point in time provided as the dt argument:
[ ]:
agm.plot_temperature_map(
    ts_gdf,
    dt=datetime(year=2021, month=8, day=15, hour=21),
    plot_kws=dict(edgecolors="black"),
)
<Axes: title={'center': '2021-08-15 21:00:00'}>